The spend feels invisible. You fire off a refactor, let an agent grind through a test suite, hop between projects and models — and no number ever flashes on screen. A month later you have no idea whether you spent $8 or $80.
The good news: Claude Code logs every token locally, on your machine. Nothing is hidden. You just need to know where to look.
What drives your cost
Not all tokens are priced the same. A few levers do most of the work:
| Factor | Effect |
|---|---|
| Output tokens | Most expensive — several times the input price |
| Input / context | Grows with long sessions as files and history pile up |
| Cache reads | Much cheaper than fresh input (often ~1/10 the price) |
| Model tier | Opus > Sonnet > Haiku; Opus can be ~5x Sonnet |
The practical takeaway: your bill is usually dominated by input, not the code you see — and by which model did the heavy lifting. Long agentic sessions carry accumulated context forward on every step, so multi-hour runs on Opus are where cost piles up fastest.
Where the data already lives
You don't need telemetry, a login, or a special mode. Claude Code writes a full transcript of every session to local disk:
~/.claude/projects/**/*.jsonlEvery assistant message carries a usage block — input, output, cache creation, and cache read tokens, plus the exact model id. Multiply each token type by the current per-model price and you have your real, per-session cost. Any tool that reports Claude Code cost is just reading these files.
Three ways to see your cost
| Method | Effort | Output | Best for |
|---|---|---|---|
/cost (in-session) | None | Single number, in-terminal | A quick gut check mid-task |
[ccusage](https://github.com/ryoppippi/ccusage) (free CLI) | npx, on demand | Text tables (daily/monthly) | Terminal folks who want history |
| Dinoradar (GUI) | Install once | Live charts, filterable | Glancing at trends per model/project |
**/cost** prints cost and tokens for the current session. Zero setup, but no history and nothing after you close the terminal.
**ccusage** is a popular open-source CLI that parses the same ~/.claude files into usage tables. Free, fast, and a genuinely good answer if you live on the command line — you just invoke it on demand and read text.
Dinoradar is a macOS menu-bar app that reads the same local transcripts and turns them into a live dashboard: cost in USD, tokens in/out/cache, daily charts, and your top models, projects, and tools — all scoped by a time-range filter (Today / 7D / 30D / All). Pricing auto-fetches per exact model id, so figures track real rates.
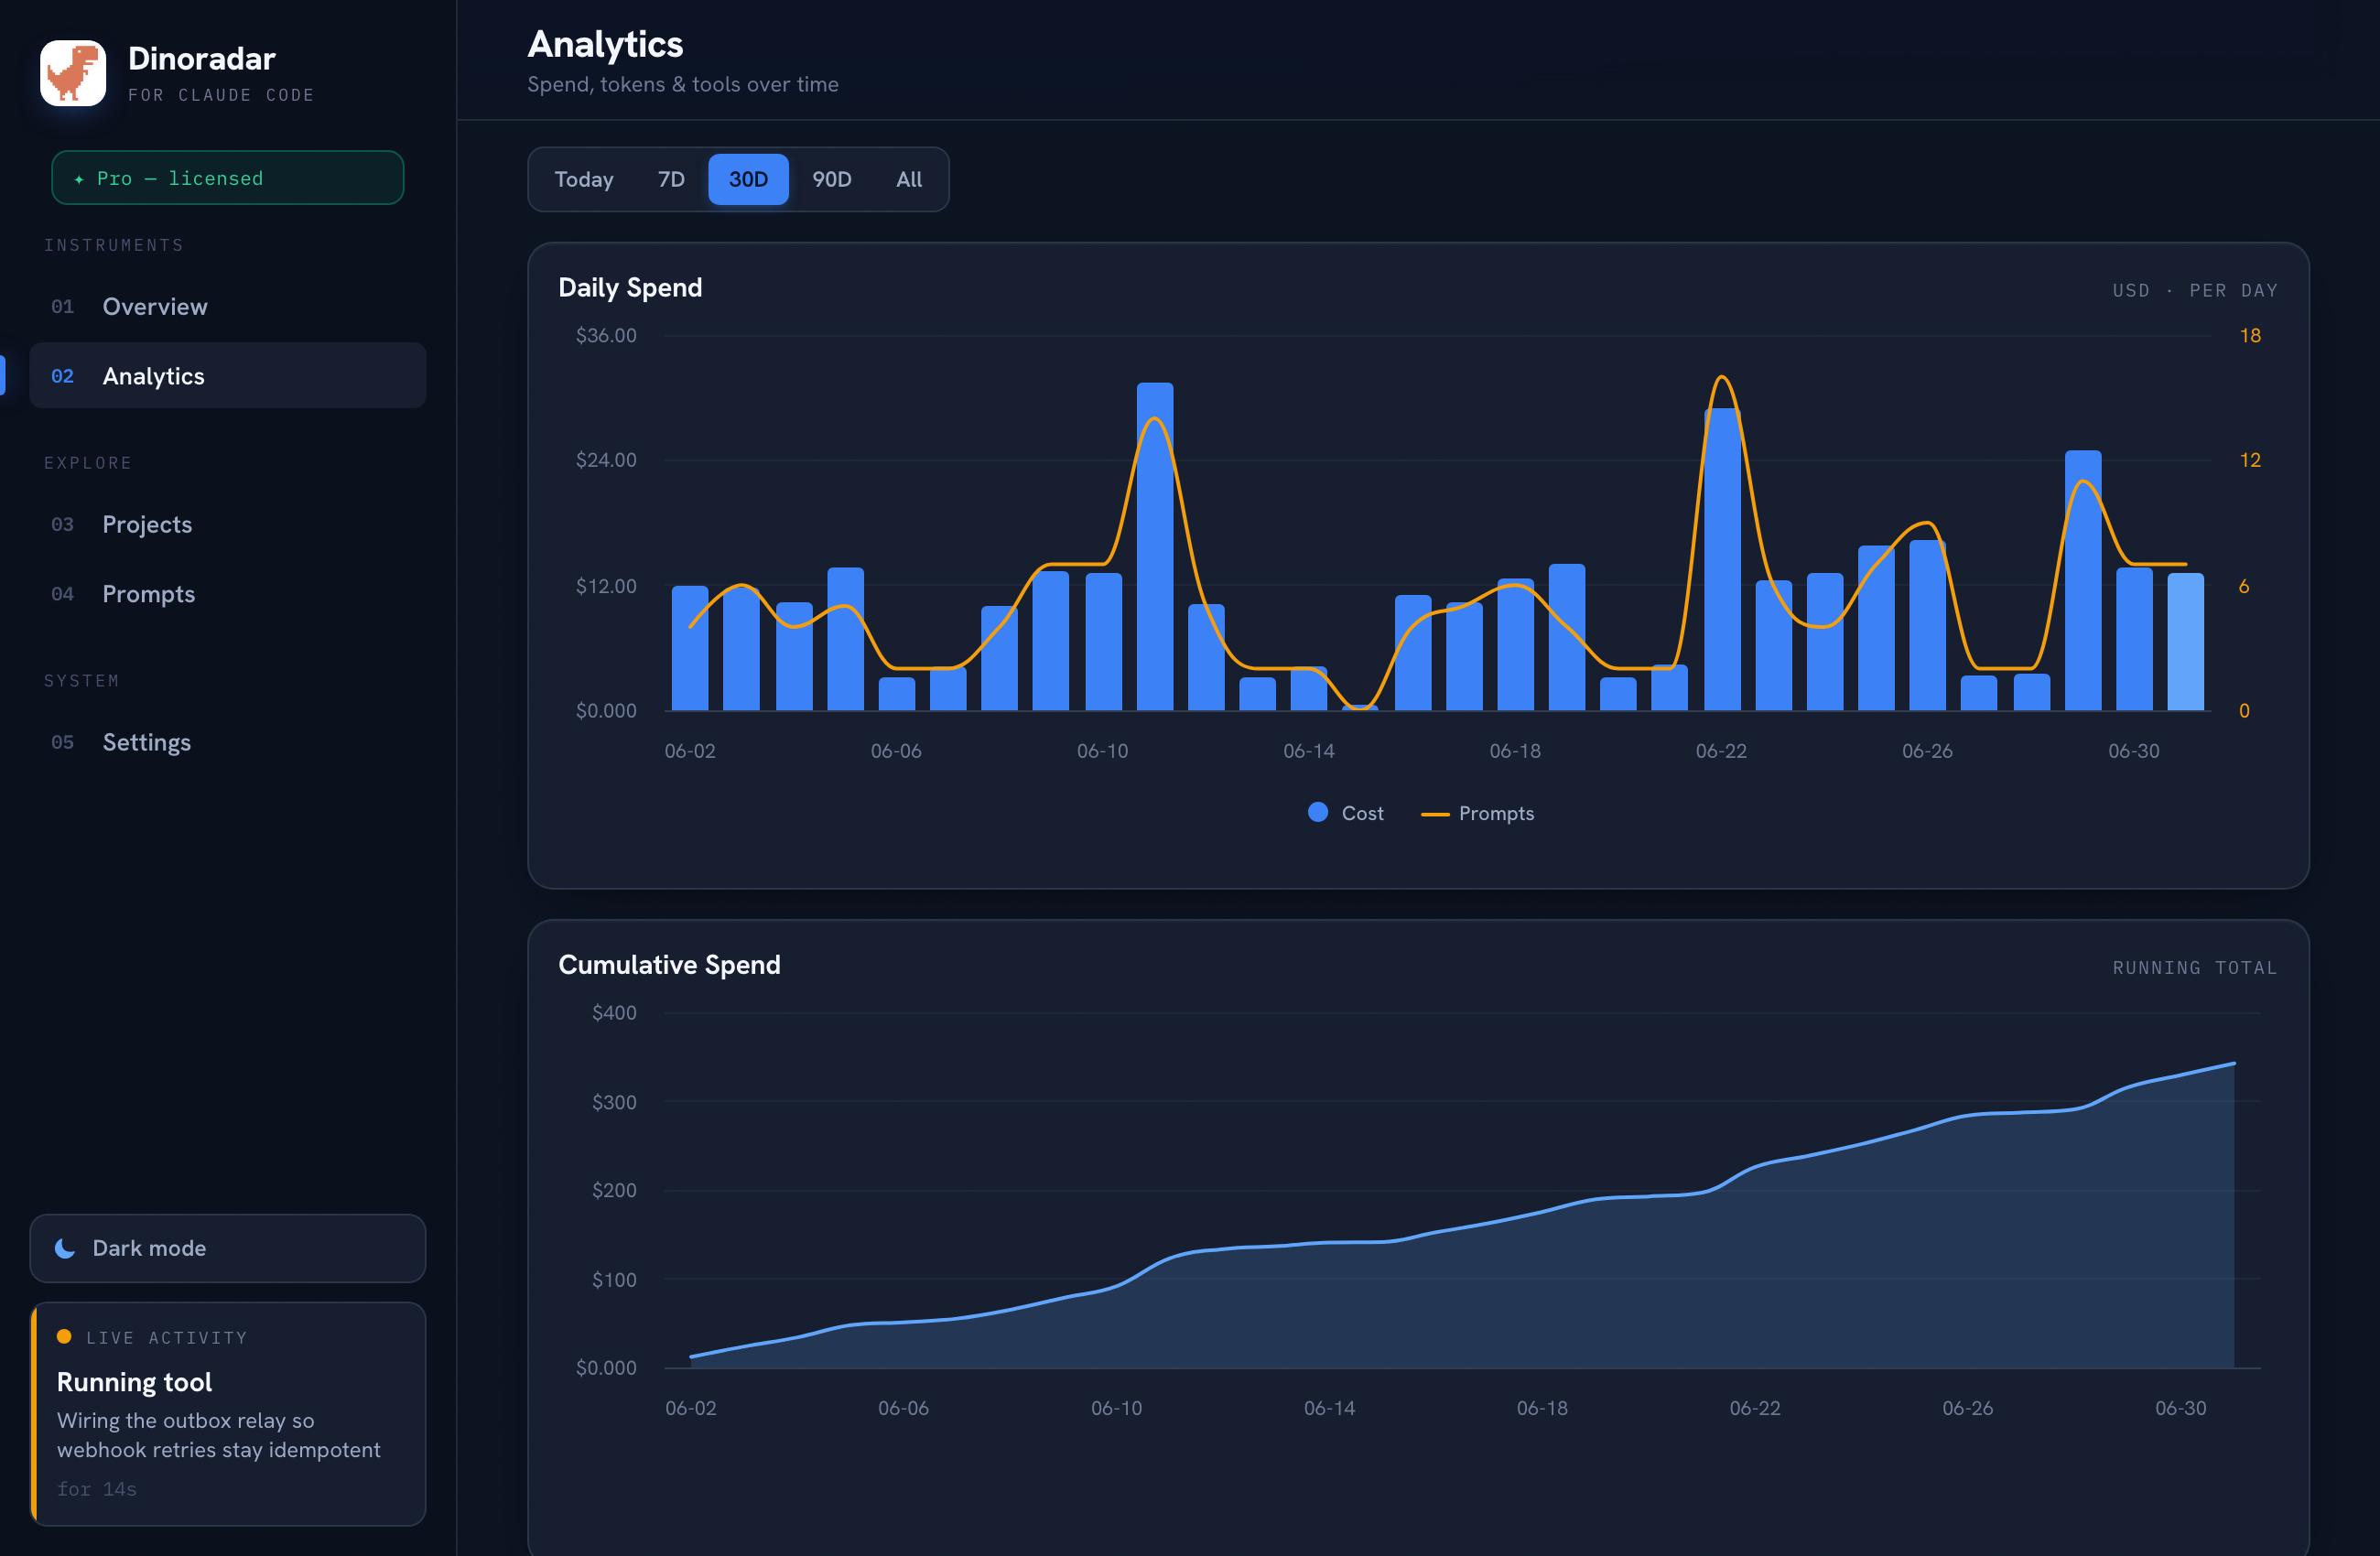
It reads ~/.claude/projects/**/*.jsonl read-only. No telemetry, no session restart, full history on first run, 100% local — no account, nothing leaves your machine. The point is glance-ability: click the icon, flip to 30D, and spot that one project on Opus eating your month.
Subscription vs. API-equivalent
One honest caveat: on Pro or Max you pay a flat monthly fee, not per token — so these dollar figures aren't a bill you'll receive. They're notional API-equivalent spend: what those exact tokens would cost at pay-as-you-go rates. Still useful — if that number dwarfs your subscription, it's clearly a good deal — just don't read it as a literal invoice.
See your full history
Your usage is already on disk; you just need something to read it. /cost and ccusage are solid free options. If you'd rather glance at a dashboard with charts and per-model breakdowns, Dinoradar is built for exactly that: 14-day free trial, then a one-time $29 (up to 3 Macs), 100% local.
See your full history at dinoradar.com/#get.
Dinoradar is an independent tool and is not affiliated with, endorsed by, or sponsored by Anthropic. "Claude" and "Claude Code" are trademarks of Anthropic.